
Written by Divyanshi Bhamri, QA Engineer at MyGate
1. Introduction
Hello again. This is the second article of a series on performance testing with Locust. I strongly suggest that you take a look at part 1 of the series so that you are ready with environment setup.
Note: As a prerequisite, you need to be familiar with Python to create test scripts.
It is time to familiarise ourselves with few Locust centric attributes [1].
2. TaskSet
Class defining a set of tasks that a Locust user will execute is known as TaskSet. When a TaskSet starts running, it will pick a task from the list of activities marked with a task attribute, execute it, and call its wait_function which defines a time period to sleep. This defaults to a uniformly distributed random number between min_wait and max_wait milliseconds. It will then schedule another task for execution and repeat the process.
3. HttpLocust
For making HTTP calls, we need a class that inherits from HttpLocust. Here we can define other attributes, such as min_wait and max_wait as required.
Note: min_wait and max_wait can be defined in classes inherited either by TaskSet or HttpLocust. In our example we will be defining these attributes at class inherited by HttpLocust.
Step 1: Save this script with .py extension. I have saved this script as locusthello.py.
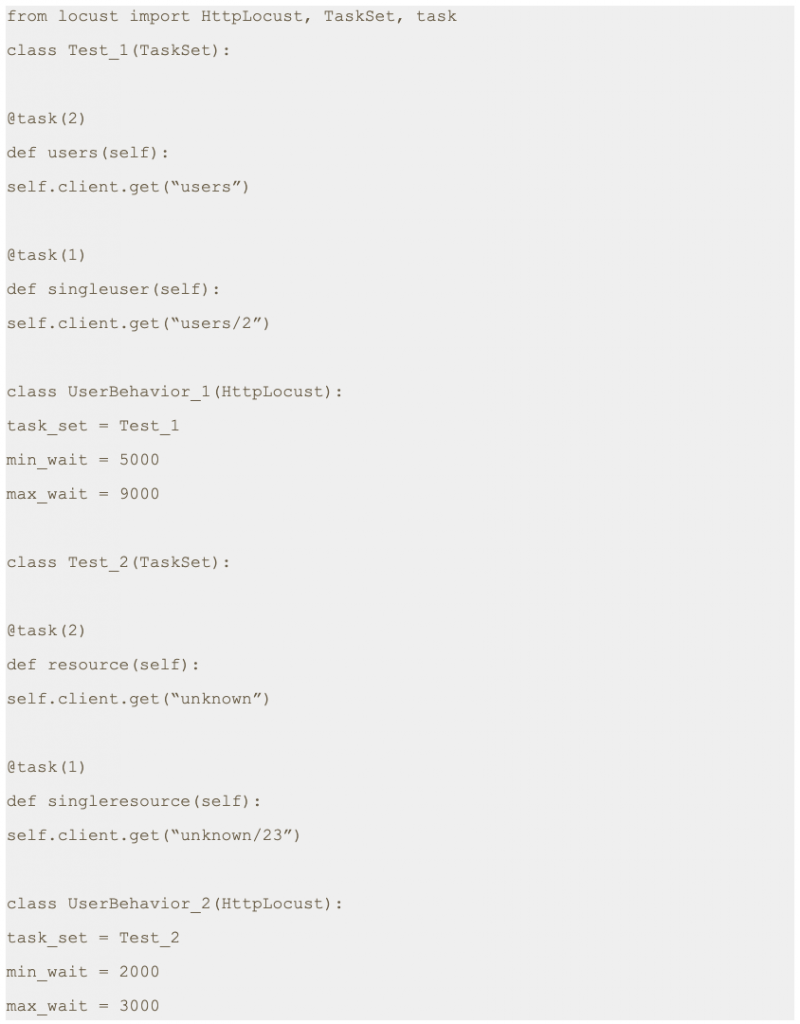
Note: In this script we are making four different GET requests to four different end points. But one of the main variables which is missing is the domain name. We will pass the domain name while running the test script from the command line with -host parameter.
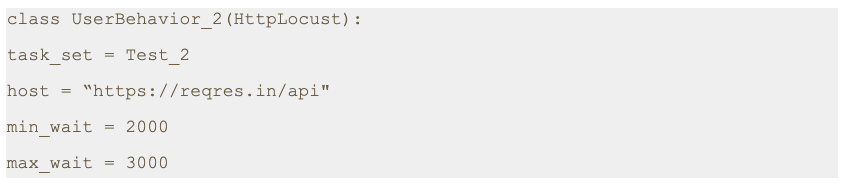
If required, we can just add a host variable within class as shown below.
4. Script execution
Step 2: Run the following command.

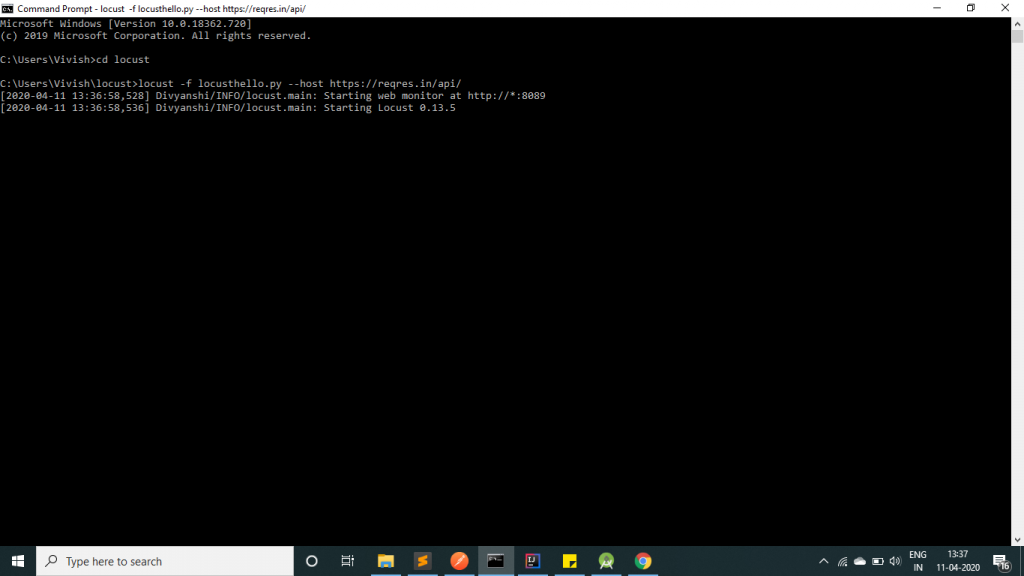
As you can see in the image, the server has been started at port 8089.Step 3: Open a browser and navigate to http://localhost:8089
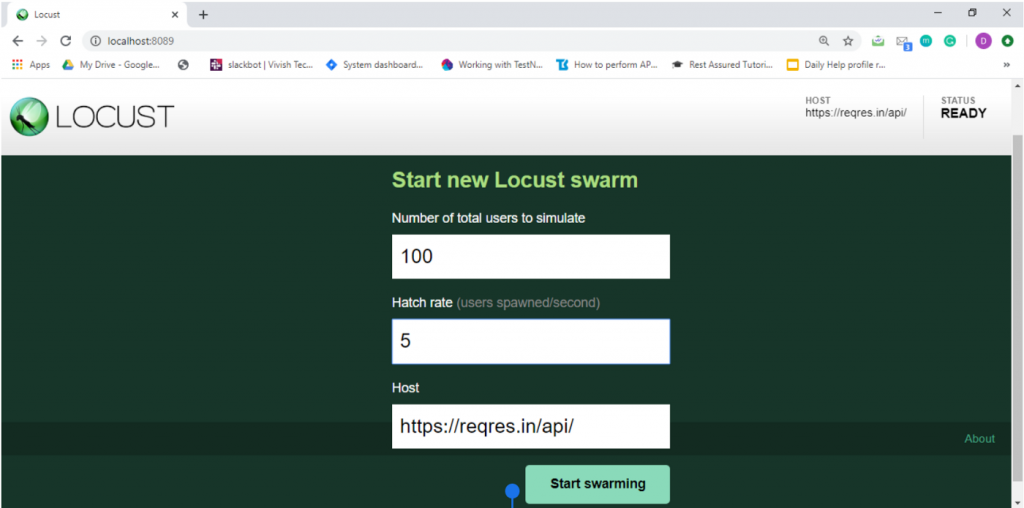
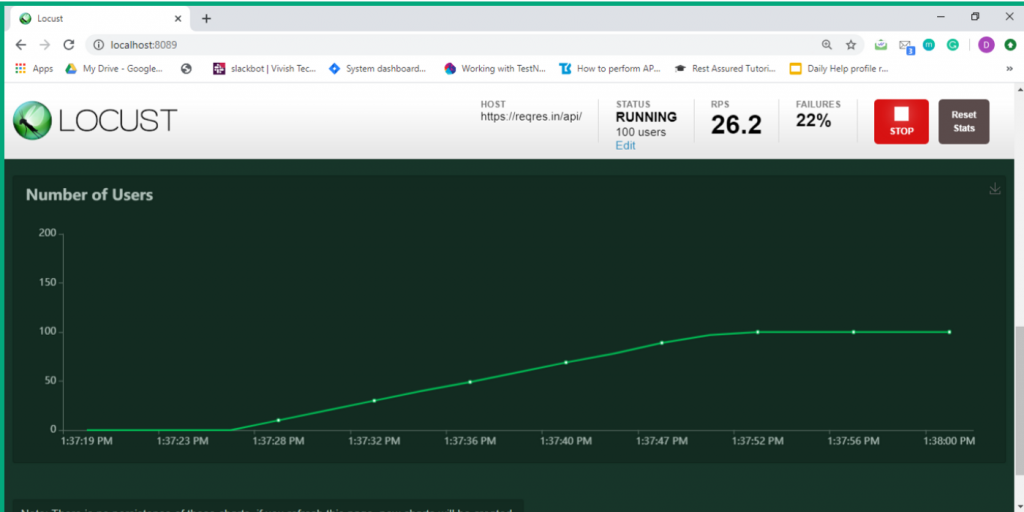
Once the page loads, you will notice two input text boxes. You need to set the maximum number of users to simulate and hatch rate which indicates ramp-up rate. I have set a configuration of 100 users with a hatch rate of 5. This translates to adding 5 users to the pool at a time until we reach 100 users. Click on submit.
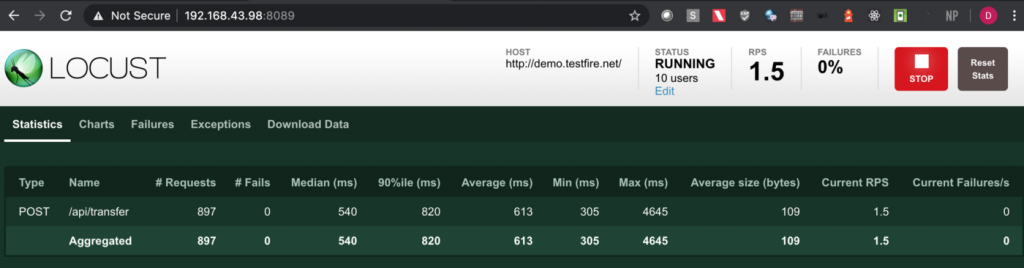
Step 4: The test process starts automatically and you will see results flowing in immediately.
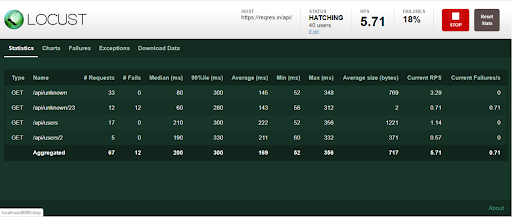
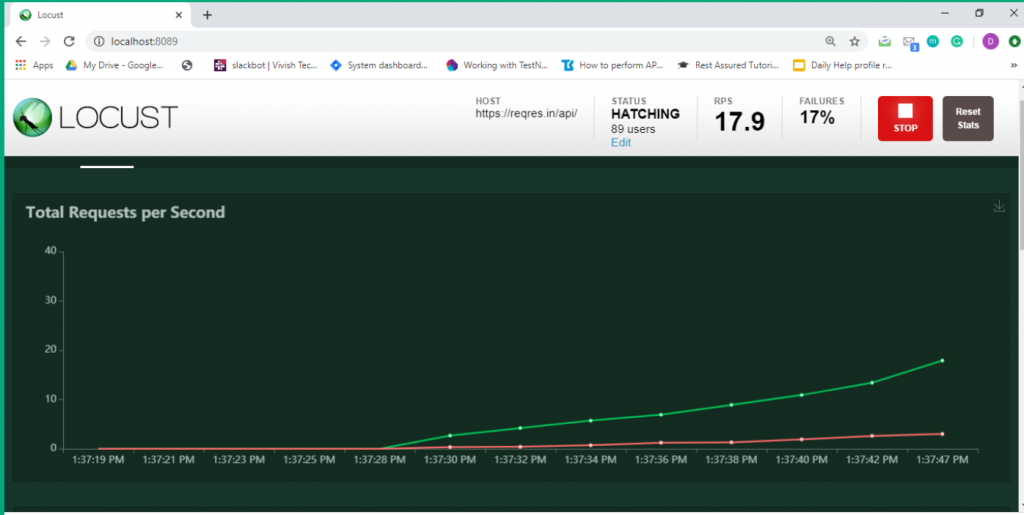
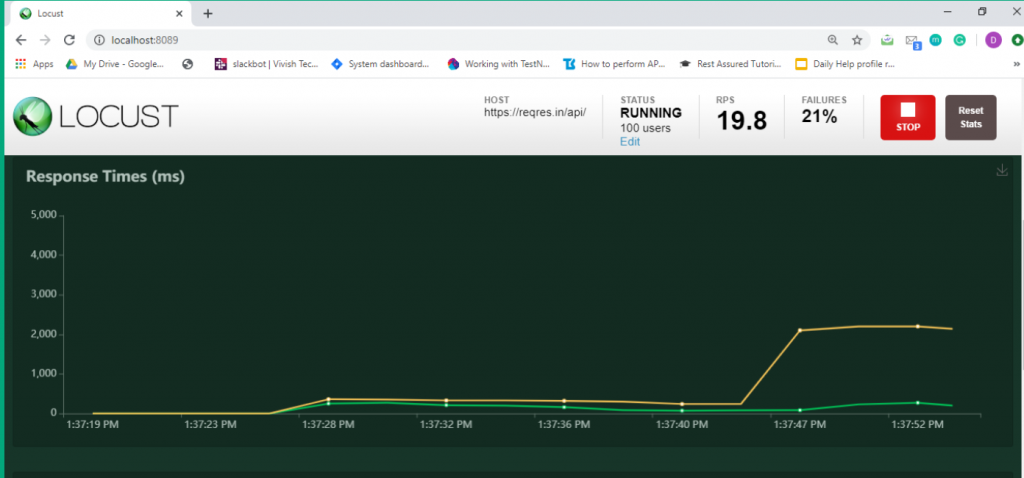
Step 5: Now click on the charts tab. You can inspect different categories of charts such as total request/ second, response time and number of users.
5. Conclusion
This is the second article of its series. In the next post we will learn about how to send POST requests.
Thanks for reading. I hope this article helps you trigger GET requests.
References
[1] Locust Documentation
https://docs.locust.io/
[2] Mock API
https://reqres.in/api
Disclaimer
This is a curated post of an article published at Medium.
Written by Divyanshi Bhamri, QA Engineer at MyGate
1. Introduction
Hello again. This is the third article of a series on performance testing with Locust. I strongly suggest that you take a look at part 1, 2 of the series so that you are ready with environment setup and basic script knowledge.
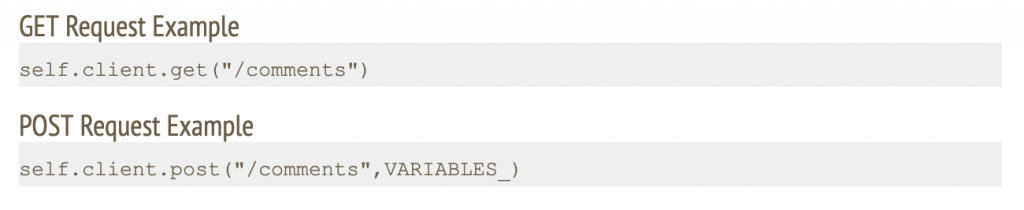
By now you should be familiar with issuing GET requests to an endpoint using Locust. Today I will be speaking about how to make a POST request and extract a response.
The primary difference between a GET and POST request is that the latter is accompanied with a content body. This content can be JSON data, form parameters or multi-form data.
Note: We are going to use jsonplaceholder [2] and reqres [3] restful web services to demonstrate our examples.
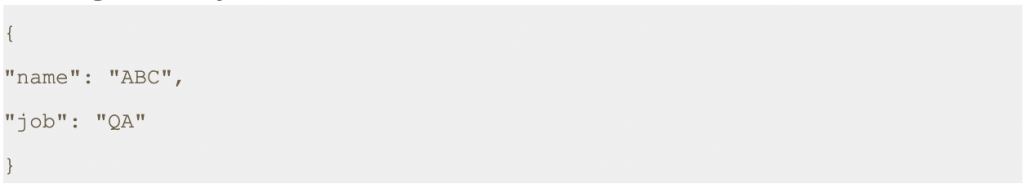
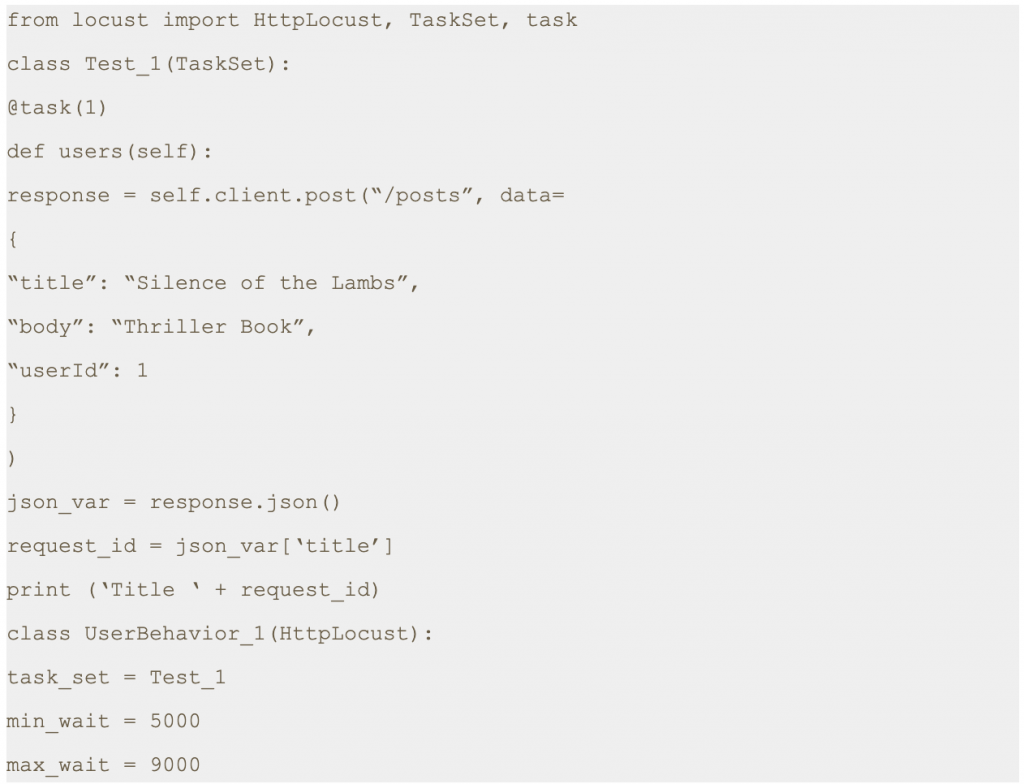
2. Case: Making POST request with JSON body
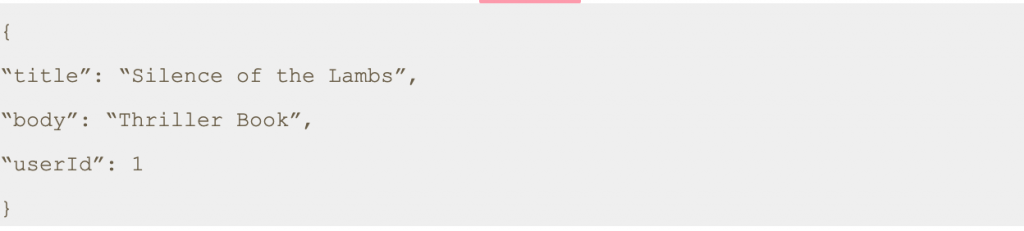
In this scenario, we will make a POST request to /api/users at https://reqres.in along with the following JSON body.
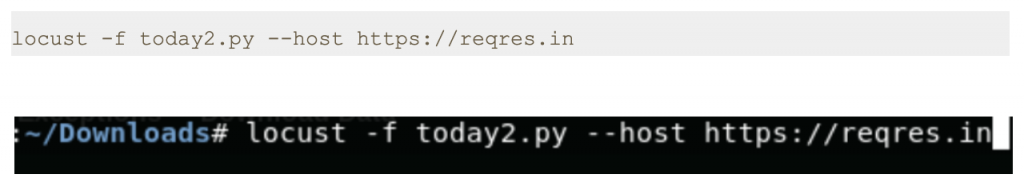
Step 1: Save this script with .py extension. I have saved this script as today2.py.
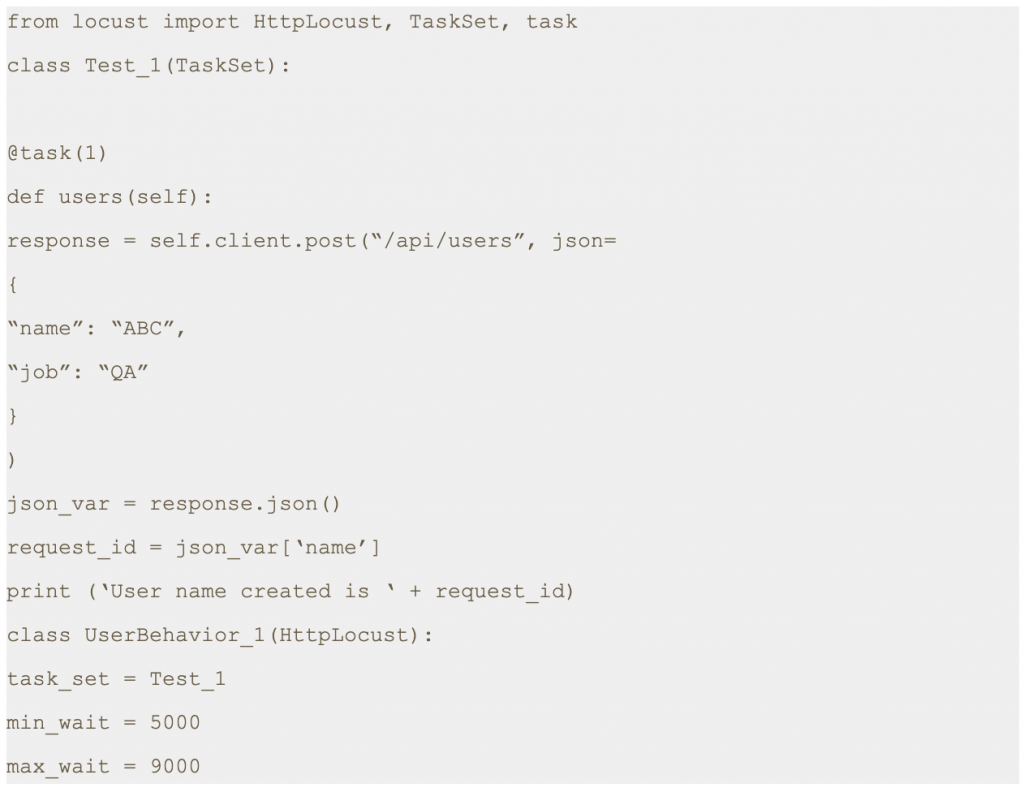
Note: First, you need to assign a response to the output of the POST request. Second, you should convert the response body to a JSON string. Finally, you should extract the desired value by using a JSON expression.
The last line is going to print the result on the terminal. It is optional.
Step 2: Run the following command.
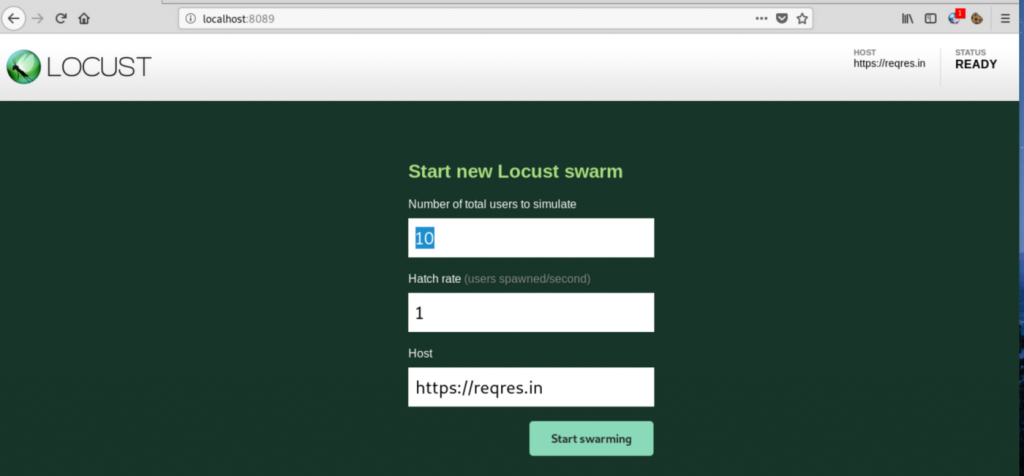
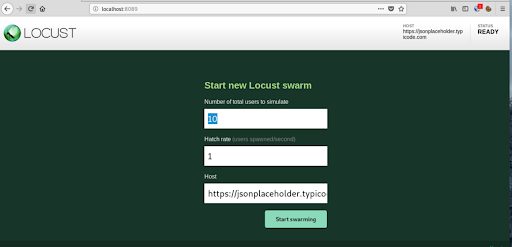
Step 3: Open a browser and navigate to http://localhost:8089
Step 4: Once the page loads, enter the number of users and hatch rate. Click on the ‘Start swarming’ button.
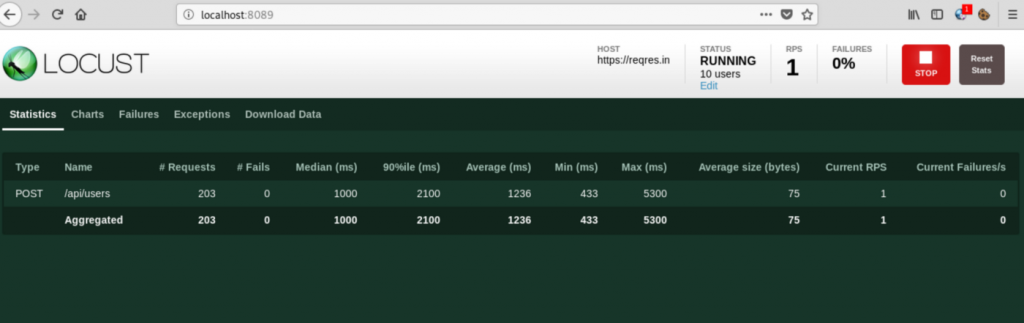
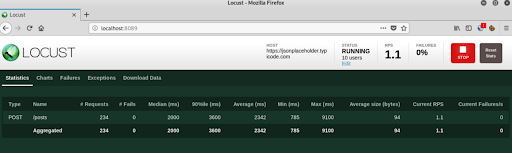
Step 5: Check Locust UI. The test process should have started automatically.
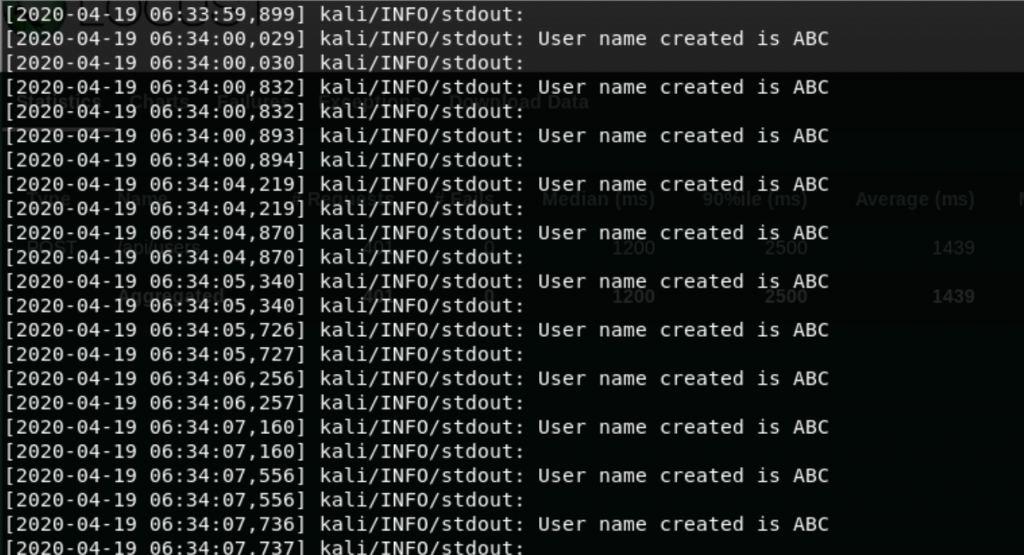
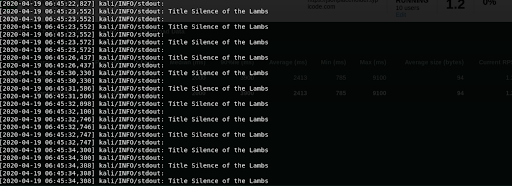
Note: In the script shared above we have printed a response attribute which is part of the sent request. This prints the name of the user as shown in the console.
3. Case: Make POST Request with Form Data
In this scenario, we will make a POST request to /posts at https://jsonplaceholder.typicode.com with following form data.
Step 1: Save this script with .py extension. I have saved the file as today3.py.
Step 2: Run the following command.

Step 3: Open a browser and navigate to http://localhost:8089
Step 4: Once the page loads, enter the number of users and hatch rate. Click on the ‘Start swarming’ button.
Step 5: Check Locust UI. The test process should have started automatically.
Note: In the script shared above we have printed a response attribute which is part of the sent request. This prints the title as shown in the console.
4. Conclusion
This is the third article of its series. In the next post we will learn about how to send authenticated requests using locust.
Thanks for reading. I hope this article helps you trigger POST requests.
References
[1] Locust Documentation.
https://docs.locust.io/
[2] Mock API
https://reqres.in/api
[3] Fake Online REST API for Testing and Prototyping
https://jsonplaceholder.typicode.com/
Disclaimer
This is a curated post of an article published at Medium.
Written by Divyanshi Bhamri, QA Engineer at MyGate
1. Introduction
Hello again! This is the fourth part of my series on performance testing with Locust. I hope you all enjoyed my previous posts.
In this article we will talk about sending the GET and POST authentication requests using Locust.
Note: We are going to use hosts similar to reqres [1] restful web services to demonstrate our examples.
Authentication can be done in 2 ways such as:-
- Cookie based
- Token based
We will be covering token based authentications. Token can either be put in request headers or request body.
2. Case: GET Request Using Token in Request Headers
Note: For GET authenticate requests, a token can only be put in the request headers, since GET does not have any body.
We will be using https://demo.testfire.net/swagger/index.html, a swagger file which can be used to make an API request to a particular endpoint.
Try to grab the authorization token, using the swagger link mentioned above.
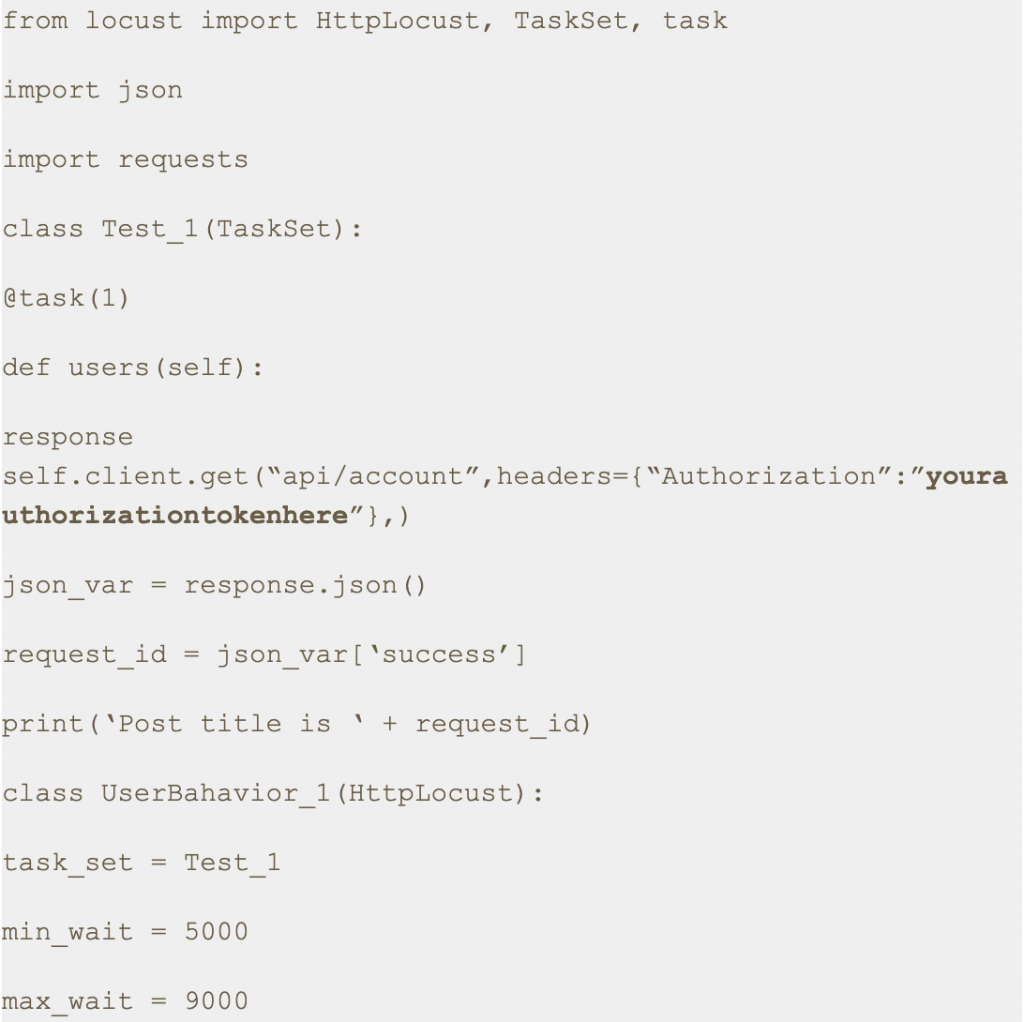
Step 1: Save this script with .py extension. I have saved this script as auth2.py.
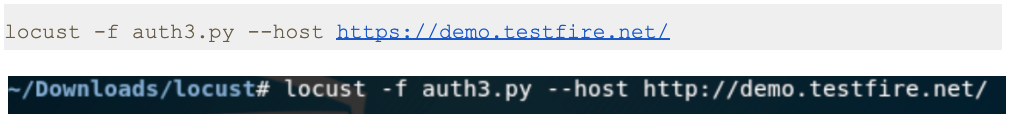
Step 2: Run the following command.

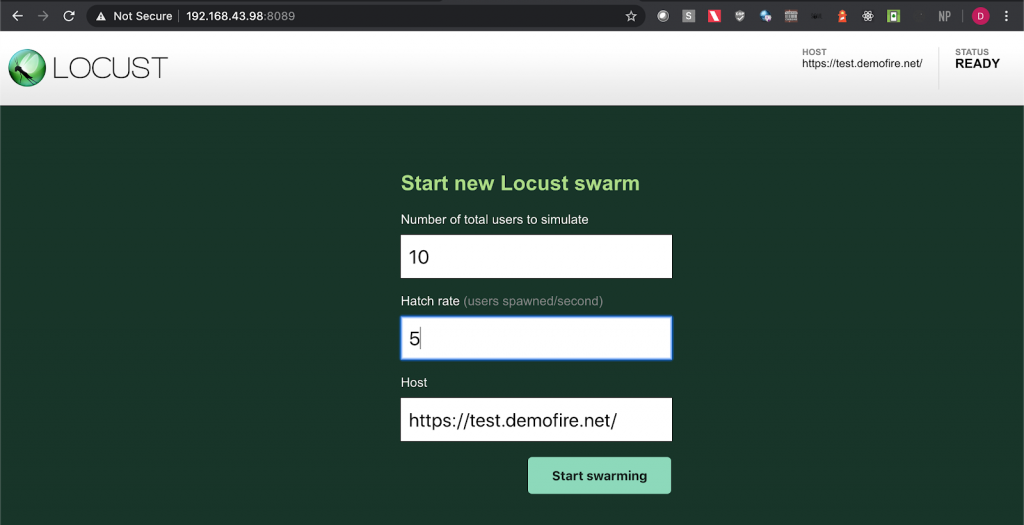
Step 3: Open a browser and navigate to http://localhost:8089
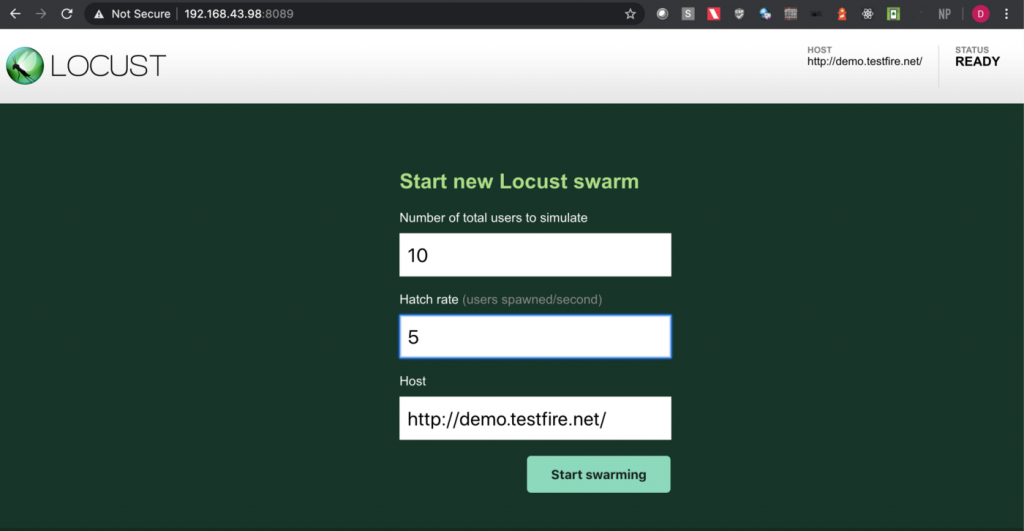
Step 4: Upon opening the page, enter the number of users and hatch rate. Click on the ‘Start swarming’ button.
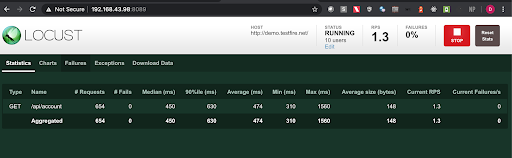
Step 5: Check the locust UI, in which the test starts automatically.
Note: In this approach we first get the authorization token using one of the api endpoints in the swagger file and then we put the same token in the headers section with the key ‘Authorization’ in the python script.
3. Post Request Cases
3.1. Case: Sending POST request with token in the Body Parameter
Step 1: Save this script with .py extension. I have saved this script as auth.py.
Step 2: Run the following command.


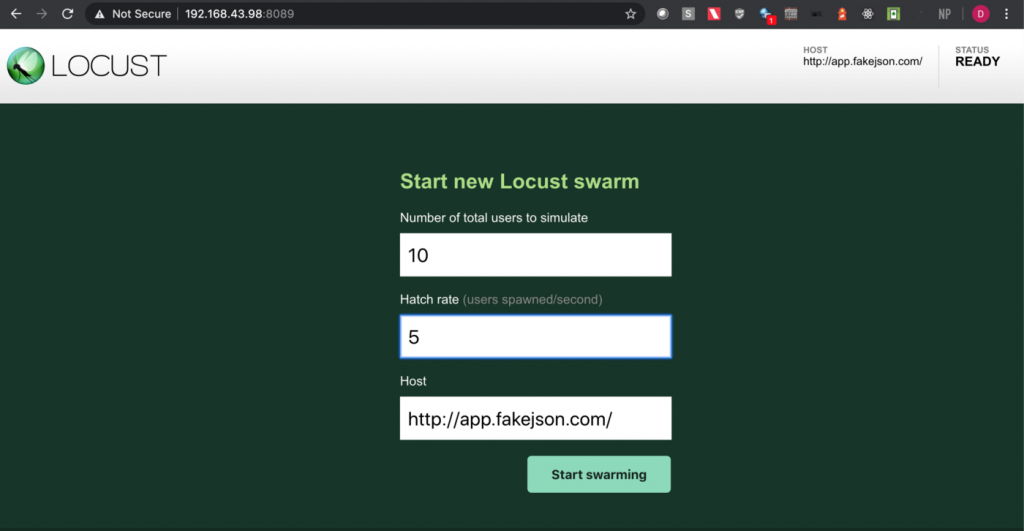
Step 3: Open a browser and navigate to http://localhost:8089
Step 4: Upon opening the page, enter the number of users and hatch rate. Click on the ‘Start swarming’ button.
Step 5: Check the locust UI in which the test starts automatically.
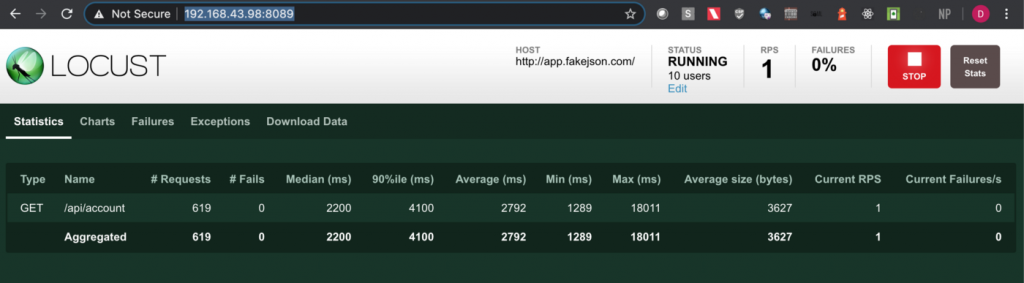
Note: I have used https://app.fakejson.com [3] for testing this endpoint. Just signup, get the token and replace the token field with yours. The token in this script is placed in the body parameter with the key set as ‘token’.
3.2. Case: Sending POST request with token in the Request Header
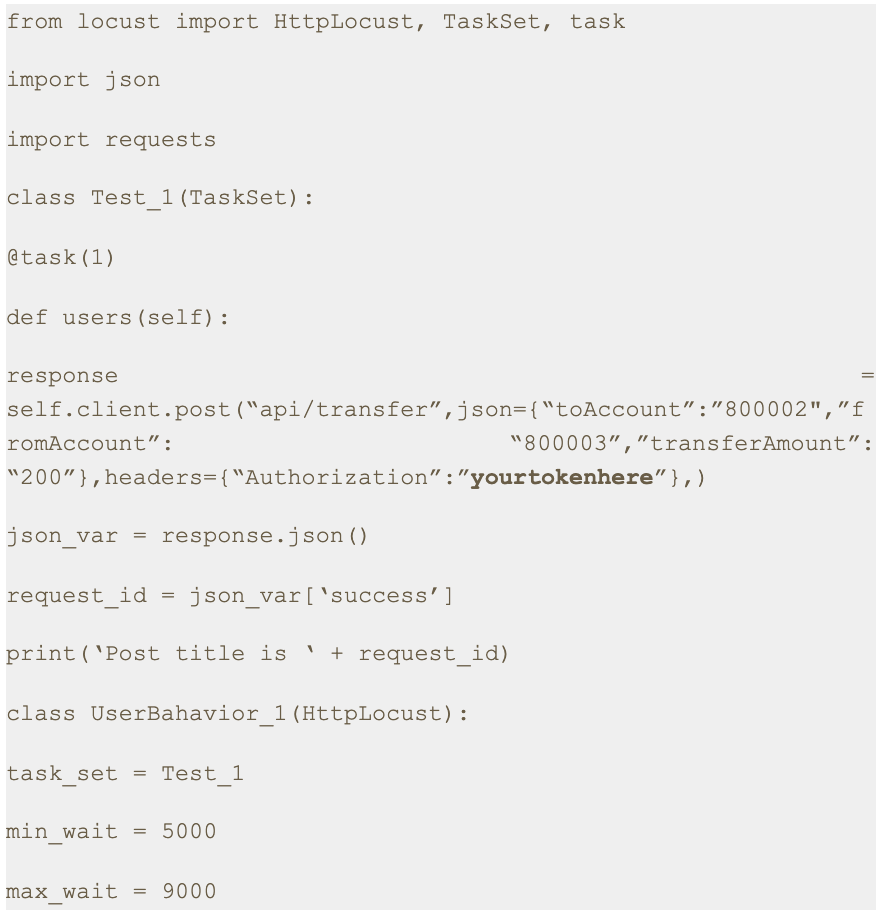
Step 1: Save this script with .py extension. I have saved this script as auth3.py.
Step 2: Run the following command.
Step 3: Open a browser and navigate to http://localhost:8089
Step 4: Upon opening the page, enter the number of users and hatch rate. Click on the ‘Start swarming’ button.
Step 5: Check the locust UI in which the test starts automatically.
Note: In this approach we first get the authorization token using one of the API endpoints in the swagger file and then we put the same token in the headers with the key set as ‘Authorization’ in the python script.
4. Conclusion
This is the fourth article of the series. In the next part we will learn about some more interesting aspects of Locust [4].
Thanks for reading. I hope this article provides you with a better idea about how to send an authenticated request for both GET and POST methods.
References
[1] Mock API
https://reqres.in/api
[2] Vulnerable Application
https://demo.testfire.net/
[3] Fake Online REST API for Testing and Prototyping
https://app.fakejson.com
[4] Locust Documentation.
https://docs.locust.io/
Disclaimer
This is a curated post of an article published at Medium.
Use Mygate Digital Notice Board, to easily & quickly share important updates, announce events and provide information to the residents. It is a single medium of communication for your community, and a source of truth for the residents.
Here’s how you will benefit…
– Send all critical announcements via a single medium of communication
– Avoid loss of crucial information on chat groups and emails
– Make verified information available to all residents
– Skip walking to the traditional notice board with paper notices
Latest Enhancements…
a) Notice via mobile: Send and share notices via the Admin app
b) Notice Print: Take printouts of the digital notice board
c) Add details: Upload images, gifs, thumbnail/cover images, enter a title, notice type, descriptions, add inline images, & embed URL in notice text
d) Share notices: Share the notice on your app with Non-Mygate users on WhatsApp or Telegram
How it works for the MCs…
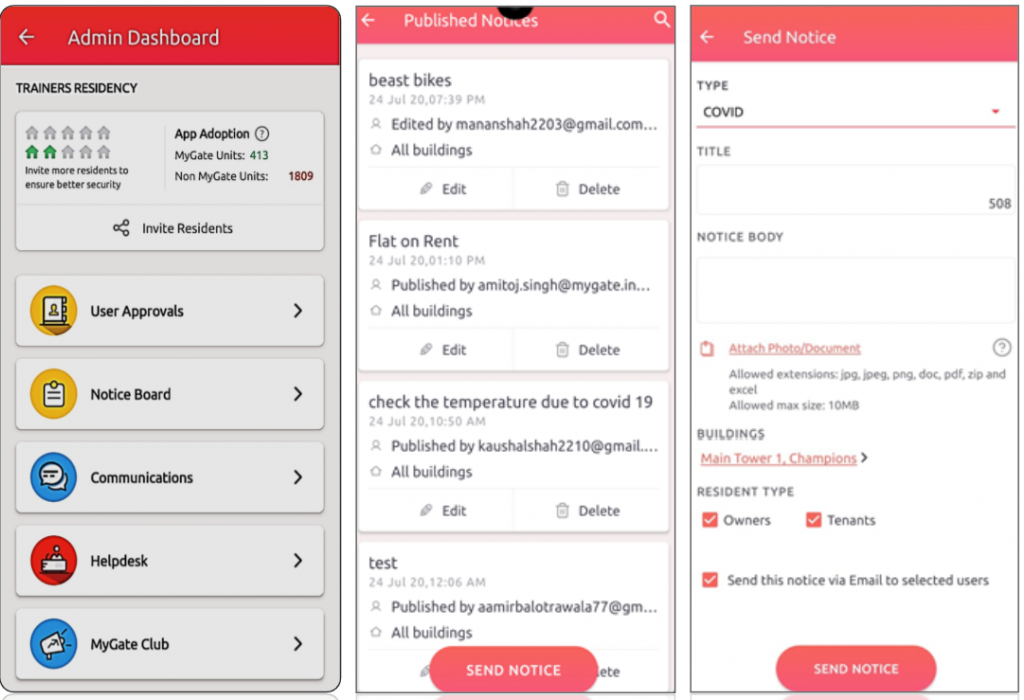
A) Sending a notice via the Admin App
1. Go to the admin app and click on the admin console and then select Notice Board.
2. Admins can click on Send Notice to create a new notice. They can edit or delete old notices
3. Now select the notice type, the notice title (character limit is 70 characters), upload up to 5 attachments (one attachment of 20MB each).
4. Select the building details and resident type. The notice is ready, now click on Send notice.
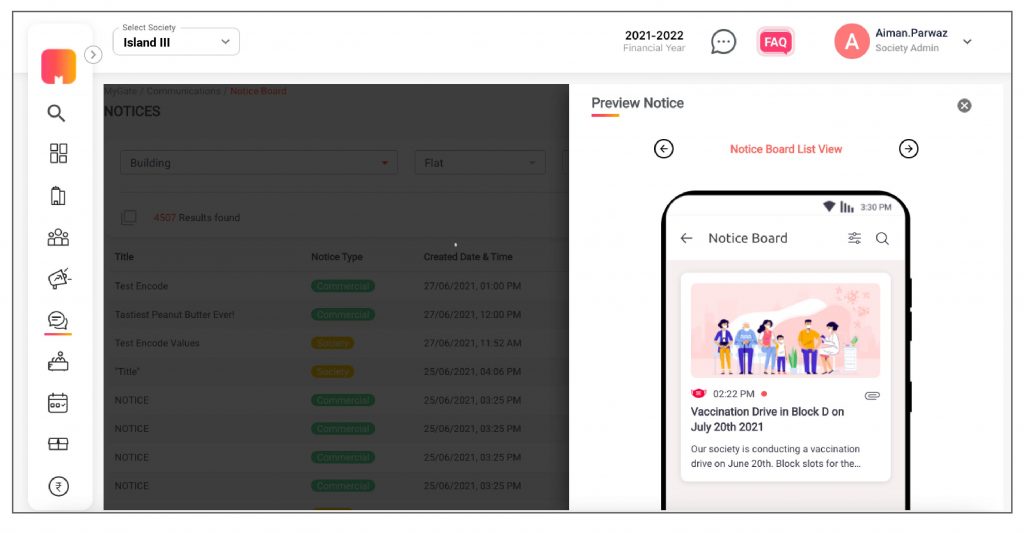
B) Sending a notice via the Admin Dashboard
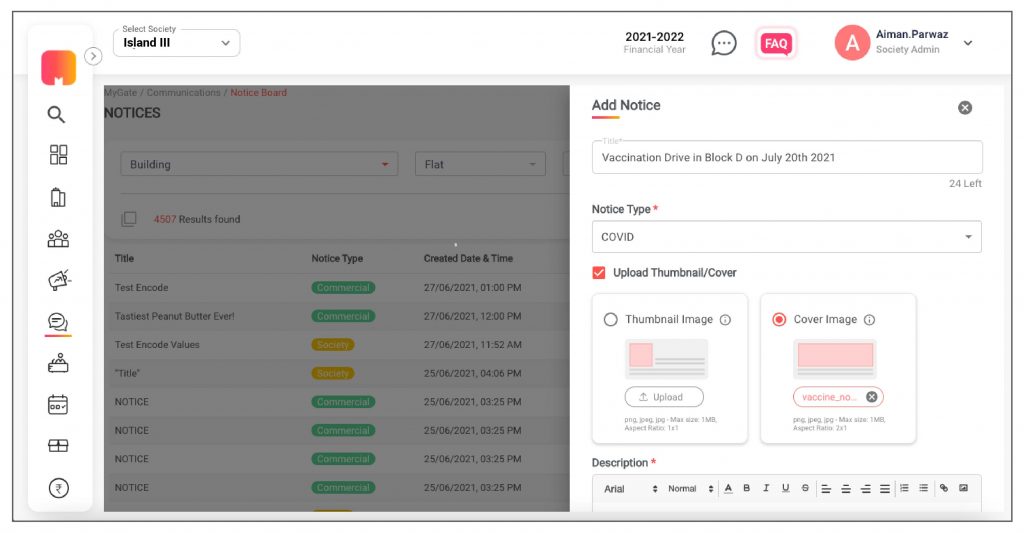
1. Go to the communication tab on the admin dashboard and click on new notice.
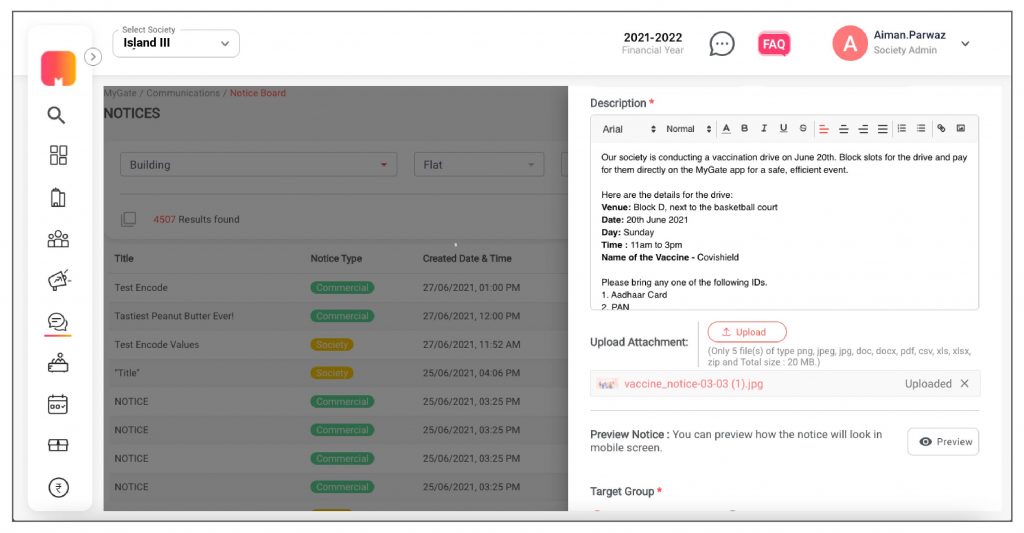
2. With the new enhancements, the admin can enter title (Character length 70 character), notice type, descriptions, add inline images, embed URL in notice text, set publish date and type. The admin can add attachments (jpg, jpeg, png, doc, pdf, zip, and excel) that are up to 20 MB.
3. The admin can select “Upload Thumbnail/Cover, upload a thumbnail/cover image. The thumbnail ratio has to be 1×1 and the cover image ratio should be 2×1.
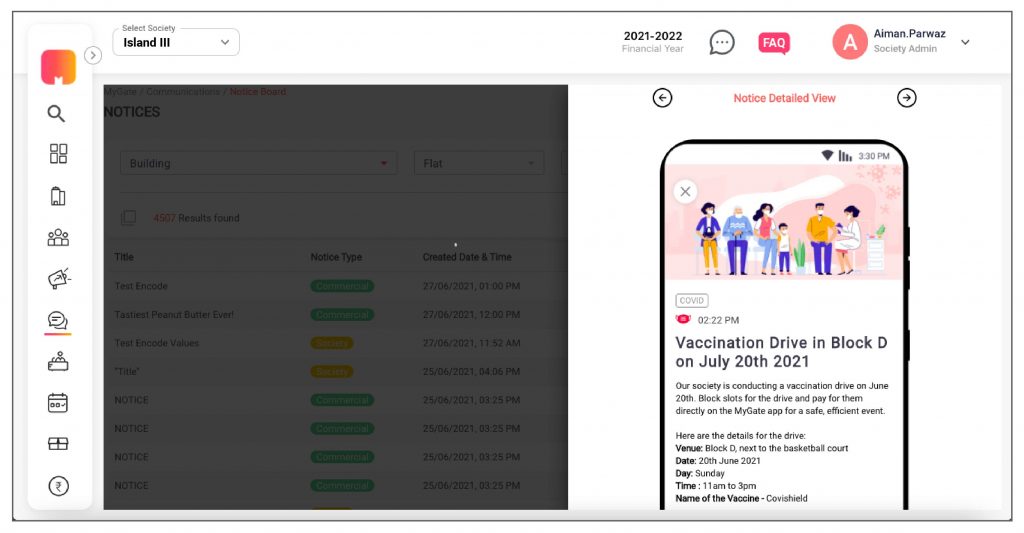
4. Before sending the notice, the admin can preview how the notice would look on the mobile phone.
5. The admin can choose to send a notice to a particular building, flat or resident type (owners or Tenants).
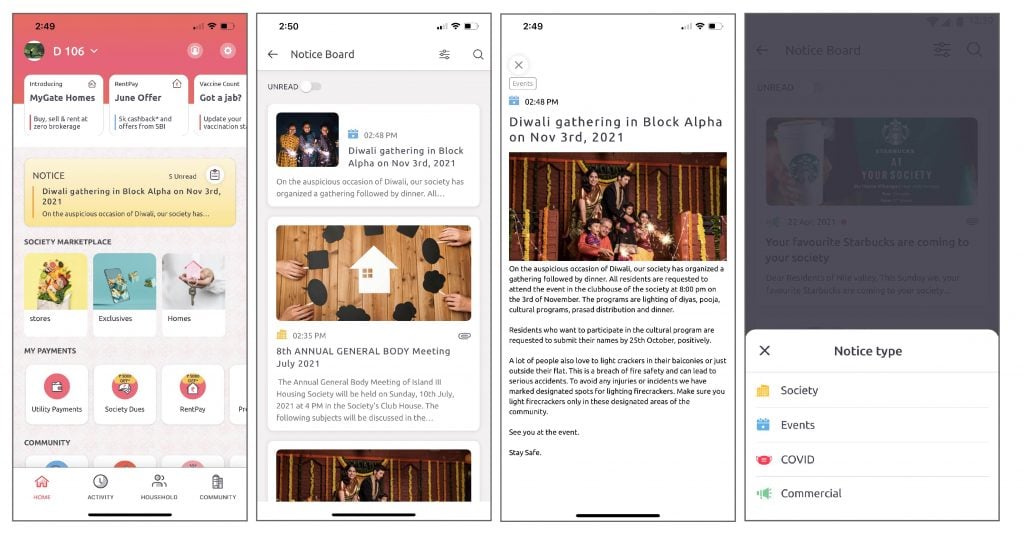
How it works for the residents…
Once the feature is enabled in the society, residents can view the notices on the ‘Homescreen’.
1. Residents can click on the icon on the notice board to go to the listing page.
2. If residents click on the notice, it will directly take them to the notice detail page.
3. Residents can view attachments and files within the notice board.
4. They can also filter out the notice type they want to view.
Enable this feature for your society and get an authorized platform for community-wide broadcasting.
Contact your management committee or Mygate relationship manager to enable Notice Board for your society today!
Written by Aravind Suresh, Data Scientist at MyGate
1. Introduction
The difference between a successful data-driven project and a subpar one is the way it is visualized and presented. Often projects lose their credibility because of the complexity in its presentation.
The archetypal presence of visualisation in any data centric project is akin to presentations in the business world. Co-incidentally the two domains are now being tightly woven with demands of data-driven insights becoming commonplace. One such request fell onto my table which required effective usage of tools to build a moving illustration to substantiate and validate a customer service use case.
This post showcases my approach to solve the problem of constructing an interactive infographic to depict the trending volume of tweets for a given topic across 24 hours in selected cities.
Disclaimer: Data sets utilised here are generated only for simulation and may not reflect actual values.
2. The data processing
The first step for any data science project is to identify your data source and process information. You begin by gaining access to the target system which can either be a public API or over a protected landscape. There may be other considerations that include movement of data from one zone to another for consumption, but that’s a topic for data engineering.
The nature of data that is under consideration here can be categorised as audit or log-based information that taps into twitter activity of members. We initiate an extract, transform, load (ETL) pipeline to allow flow of data to my workspace. The expected structure of final data set would look like;
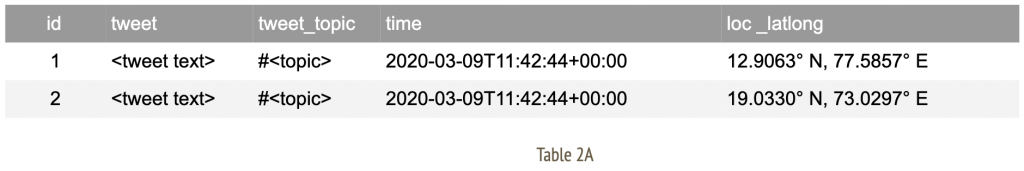
Now apply a series of data cleansing techniques such as alteration, aggregation, group by (over bucket of time) to arrive at a consumable format of information. For me, the final data set appears as;
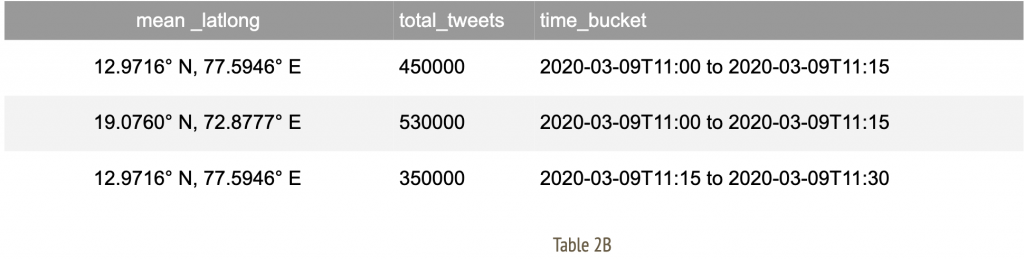
These rows indicate time slices for given city identifiers with an aggregate total number of tweets observed in that duration.A note on geographical data: Often, location specific information may arrive with geo coordinates with varying degrees of accuracy. In such an event, we attempt to establish a mean around the coordinates of selected cities. This allows us to amalgamate records specific to a given geographic location to the nearest city as observed in Table 2B.
3. Methodology to visualise
After arriving at a consumable data structure, we must construct a strategy to visualise information. At this stage, each individual time slice carries all relevant data to indicate city of origin and total tweets accumulated.
We filter upon this table by time buckets for each frame defined as;
- A maximum of 5 frames per second
- Each frame is indicative of 1 time bucket
- Each time bucket spans across a 15 minute window
Evidently, all of the frame definition rules are configurable to suit your illustration needs. We further apply the following routine for each individual frame.
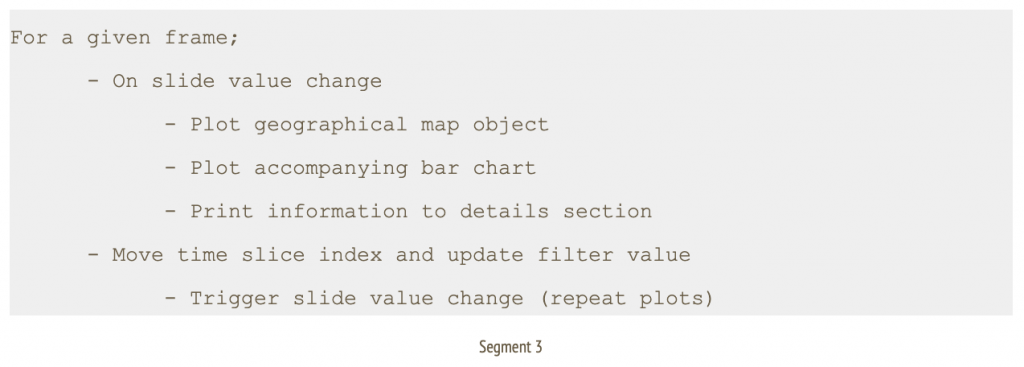
In this context, I go with a simple layout of a geographical map of the target country, alongside a horizontal bar chart of selected cities, a details section to indicate total tweets, a slider control at the top to indicate time window and an action button with play/ pause options to traverse through the slider.
3.1 The libraries
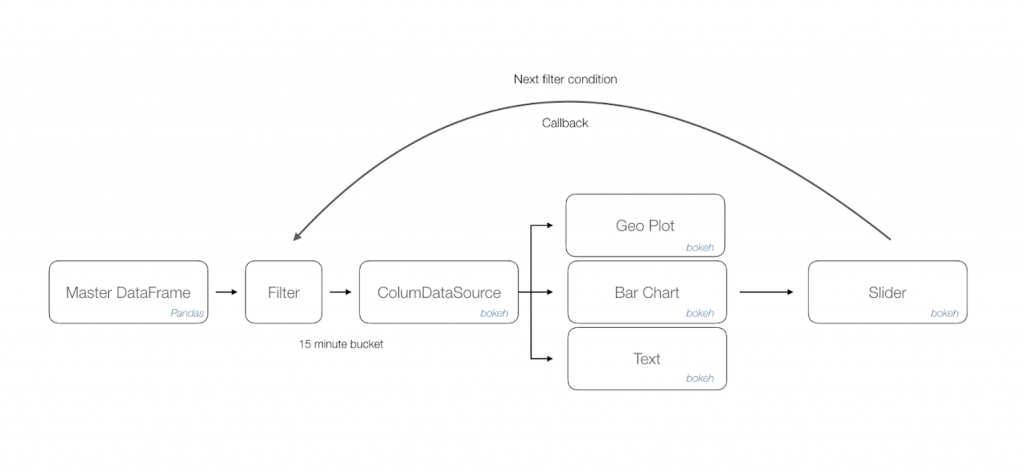
As you may have gathered, there are extensive data processing needs and the much revered Pandas [1] library comes to our rescue. The easy to use data analysis, manipulation toolkit is as powerful and flexible as advertised. The outcome of this process is a master data frame which is consumed by a downstream program.
We append a filter method listener that acts upon the data frame to load desired information onto a column data source of Bokeh [2] library. This data object manages all bindings with target renderers. Once we have isolated the visualisation controls, in this case a combination of geo plot, bar chart and text; Bokeh allows us to just update the bound column data source to achieve moving illustrations.
Finally, a slider control acts as a handler to accept time window inputs and issue necessary callbacks to the filter method thus triggering changes in all visualisation controls.
The following workflow diagram depicts approach diagrammatically
Bokeh library is a natural addition to your visualisation portfolio that would include Matplotlib [3]. The final output is exported as a html page that can be rendered through any browser. You can further use a screen recorder to convert this into a distributable format such as .mov or .gif file.
4. Other scenarios
The narrated approach can be applied to visualise a variety of data use cases that has multiple dimensions of time series, geographical coordinates and activity count. Some suggested scenarios across domains are as follows;
The narrated approach can be applied to visualise a variety of data use cases that has multiple dimensions of time series, geographical coordinates and activity count. Some suggested scenarios across domains are as follows;
- Manufacturing throughput at plants in selected cities across 24 hours.
- Online payments activity for a given year in selected cities.
- Patient treatment trends each decade for a category of ailment throughout the country.
- Track global reported cases of pandemic influenza since initial occurrence [4]
References
1. Pandas – open source data analysis and manipulation tool https://pandas.pydata.org/
2. Bokeh – Interactive visualisation library
https://bokeh.org/
3. Matplotlib: Visualization with Python
https://matplotlib.org/
4. Track Reported Cases of COVID-19
https://coronavirus.jhu.edu/map.html
Written by Siddhartha Bokaria and Sunil Kumar, Software Engineers at MyGate
1. Introduction
The pain of creation, managing and distribution of application builds is a well known topic. As it occurs during any company’s journey, we have struggled finding the right rhythm of what we term as ‘build automation’. The core necessities remain relatively standard; the need for a developer to seamlessly distribute builds to validation engineers while operating within rigid virtual private cloud (VPC) zones.
In tightly knit independent application squads, we tend to take small steps toward harmonising an application (app) distribution strategy. Provided the product build and flavour pipelines are present, we start with the bare necessity of issuing a command that allows the package flow through proxy zones and get published for consumption.
We do not plan on reinventing the wheel but favour assembling the right solutions to manage our app distribution needs. As such, first in the list of agenda is to perform a basic survey of available options.
2. Literature survey
There are a host of projects dedicated to solve this problem. Some of the prominent ones are listed below with a brief overview of their capabilities.
Fastlane [1]
As their official phrase states, “app automation done right”. This includes a suite of pipeline centric features of extracting screenshots, beta distribution, app store deployment and code signing. Definitely what we should be setting up in the long term. However this will be an overwhelming solution for a basic app distribution need amongst squad members.
Firebase [2]
Previously part of Fabric’s Crashlytics, the upcoming Firebase app distribution which is now in beta shows the most promise and falls right within our ‘goldie lock zone’. It focuses on distributing development builds to a group of testers. It allows various approaches including console, CLI and gradle based scripts reducing friction to adopt. It promotes access to builds through a simplified portal and targeted emails. It provides a basic dashboard for central management and activity overview. It supports both iOS and Android builds. And, the entire approach falls under free tier at the moment. Adding GCP to our ecosystem is a task by itself and once allowed this is a frontrunner and a panacea to our problems.
AWS mobile hub [3]
A collection of products rather than a targeted solution. It is a feasible option and would require you to align application building activities from the beginning to account for the chosen framework. A relatively steep learning curve might be a determining factor. For an ongoing set of projects such as ours, this would require additional push for a consideration.
Apple testflight and Android test tracks [4]
This is a good platform for sharing early stage releases. It is predominantly used during beta testing. You would expect a certain level of stabilisation prior to using this facility. The portals often carry download volume quotas for your app listing. We need a simpler alternative to this.
3. Our approach
Everything said and done, we were yet to figure out the right approach that fit into our workflow. Our current goal is to reduce repetitive and time consuming activities of sharing builds with the validation team. Just when velocity of iterations were making the task of sharing builds harder, we came across a simple do it yourself (DIY) app distribution platform called Librarian [1]. This looked like a good place to start with a simple command based submission interface and light UX. Though getting this to a central location was tricky whilst navigating through layers of aforementioned VPC zones, it allowed us the flexibility of carving out our own build flow. That led to the following deliberate steps to set up our own distribution pipeline targeted at an AWS environment.
3.1 Key modules
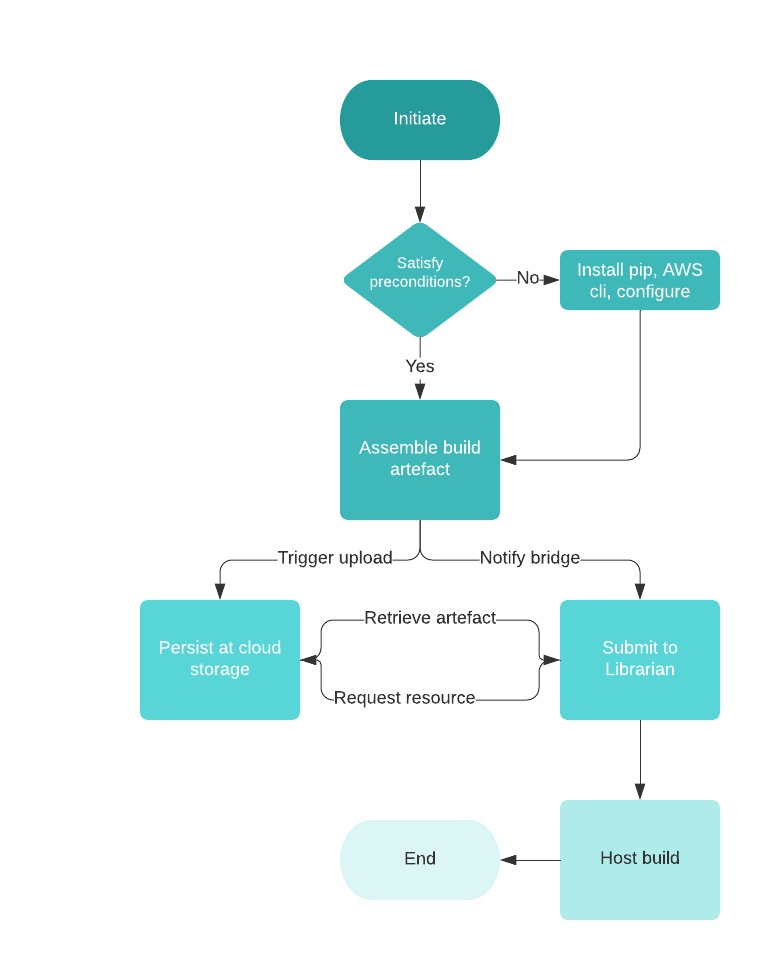
- A shell script to allow preparation of the environment. An Android engineer would ideally not want to be distracted with environmental setup required to support background operations. The script helps with installation of python package manager and AWS CLI. It also triggers configuration of AWS environments which means the developer should keep the access tokens ready.
- Gradle file extension that exposes the task to the developer. A simple configuration at project level file helps identify remote resources. The app level changes allow you to link tasks to the gradle list. Now you can chain the ‘assemblePackage’ and ‘publishRelease’ tasks for seamless build distribution.
- The final module is an example implementation of a bridge API. Librarian does not support remote submission of build currently and the accompanying NodeJS based API helps activate that feature.
3.2 Quick start (Android)
With all the prerequisites satisfied [5], set up your build environment by following these simple steps.
- Place the 2 files (s3Upload.gradle and publish_checkpoint.sh) in the app root where the build.gradle (for app) is present. Synchronise project and add files.
- Edit build.gradle (app level), put this line at EOF: apply from: ‘s3Upload.gradle’. Synchronise file.
- Edit build.gradle (project level), put following lines below allprojects: repositories section of the file:
- project.ext.AWS_S3_BUCKET = ‘s3-bucket-name’
- project.ext.BRIDGE_HOST_PATH = ‘http://localhost:3000/api/librarian’
- Synchronise file.
- Refresh gradle command list.
- The newly available commands are ready for use.
- ./gradlew tasks –all
- You should be able to locate the publish tasks under ‘other tasks’ group labelled as ‘app:publish-variant-ToS3’
- ./gradlew <publish-task-name>
- For 1st time users the utility will setup the necessary packages (pip, aws cli installation, aws environment configuration).
3.3 Illustration
And, here is the workflow illustration to assist the speed readers.
4. Roadmap
This approach is working for us and has reduced the hassle of dealing with unorganised sharing channels. Through this post, we plan to share it with other teams and seek inputs. Some may be using alternatives easier to adopt approaches that might interest us. Others may embrace it and contribute to its development. In either case, the following items have been planned.
- Extend approach to support iOS builds.
- Extend support for other cloud storage options.
- Investigate alignment to Firebase app distribution channel. The preparation script should now ideally target Firebase CLI and gradle script can be replaced by the public plugin.
Head over to our Github repository [5] and try it out yourself!
References
[1] App automation done right
https://fastlane.tools/
[2] Firebase App Distribution
https://firebase.google.com/products/app-distribution
[3] AWS Mobile Hub – Build, Test, and Monitor Mobile Applications
https://aws.amazon.com/products/mobile/
[4] Apple testflight and Android test tracks
https://developer.apple.com/testflight/https://developer.android.com/distribute/best-practices/launch/test-tracks
[5] MyGate app build distribution utility
https://github.com/mygate-tech/mg-build-automation
[6] Librarian
https://github.com/biocross/Librarian